Usefulness of Magnetic Resonance Spectroscopy for the Initial Diagnosis of Mitochondrial DNA-Associated Leigh Syndrome
Article information

Abstract
Purpose
Diagnosing Leigh syndrome (LS), a representative mitochondrial disease, remains challenging. Mitochondrial DNA (mtDNA)-associated LS, which is maternally inherited, has relatively well-known genetic variants. We evaluated the usefulness of brain magnetic resonance spectroscopy (MRS) for the initial diagnosis of mtDNA-associated LS using data from LS patients.
Methods
The study involved LS patients who visited Gangnam Severance Hospital between 2006 and 2018. Based on patients’ clinical findings, genetic evaluations, brain magnetic resonance imaging, and brain MRS findings, 24 mtDNA-associated and 49 gene-negative LS patients were included in the current study. Lactate peaks and decreased N-acetyl aspartate (NAA) peaks in brain MRS were compared between both groups.
Results
In total, 11 mtDNA mutation subtypes were detected. Our findings showed a higher proportion of brain MRS abnormalities in mtDNA-associated LS patients than in gene-negative LS patients, but no statistically significant differences were observed between the two groups (lactate peak, P=0.080; decreased NAA peak, P=0.115).
Conclusion
Brain MRS is currently limited as an initial diagnostic test for mtDNA-associated LS. However, it may be a useful non-invasive test for the follow-up evaluation of mtDNA-associated LS treatment. Ultra-high-field MRS technology is expected in the future.
Introduction
Leigh syndrome (LS) is the most representative mitochondrial disease; it results in severe neurological deficits, with the first symptoms usually appearing between 3 and 12 months of age [1-3]. This syndrome can be divided into mitochondrial DNA (mtDNA)-associated LS and nuclear gene-encoded LS. Unlike nuclear gene-encoded LS, mtDNA-associated LS is maternally inherited [4-6]. LS can be diagnosed by examining clinical and neurological symptoms, brain imaging methods such as magnetic resonance imaging (MRI) and magnetic resonance spectroscopy (MRS), assessing blood or cerebrospinal fluid (CSF) lactate levels, and performing genetic testing [6-8].
Brain MRS is a non-invasive tool that is useful for evaluating brain tissue metabolites, including lactate peaks, which are among the most important factors in diagnosing LS, and N-acetyl aspartate (NAA), choline, and creatine levels [9-11]. Brain MRS is widely used for LS diagnosis supplementally and follow-up monitoring because of its ability to detect lactate peaks in brain regions. However, its usefulness as a tool for initial LS diagnosis remains unclear, and studies on this issue are lacking [11-13]. Owing to the recent development of genetic testing for LS, very few studies have reported the relationship between the presence of pathogenic variants in LS and brain MRS findings [13,14].
Here, we studied the usefulness of brain MRS as an initial diagnostic tool for differentiating mtDNA-associated LS, which has relatively well-known genetic characteristics, from gene-negative clinical LS. We believe that our study will provide neurologists insights into the usefulness of brain MRS for LS diagnosis.
Materials and Methods
1. Study design and patient selection
This was a retrospective study consisting of patients clinically diagnosed with LS who visited Gangnam Severance Hospital between 2006 and 2018 (Fig. 1). A total of 99 patients were selected. Among these 99 patients, all patients known to have nuclear DNA-associated LS were excluded. The clinical diagnosis of LS was based on the stringent diagnostic criteria for LS formulated by Rahman et al. [2] and Thorburn et al. [6] as follows: progressive neurological disease with motor and intellectual developmental delays, signs and symptoms of brainstem and/or basal ganglia disease, elevated blood or CSF lactate concentrations, and bilateral symmetric hyperintense signal abnormalities in the brainstem and/or basal ganglia on T2-weighted MRI scans. In addition, all patients underwent MRS as an initial diagnostic test. All parents received a detailed explanation and signed an informed consent form before their wards were enrolled in the study. This study was approved by the Institutional Review Board of Gangnam Severance Hospital, Yonsei University College of Medicine, Seoul, Republic of Korea, (3-2017-0168) following the tenets of the Declaration of Helsinki.
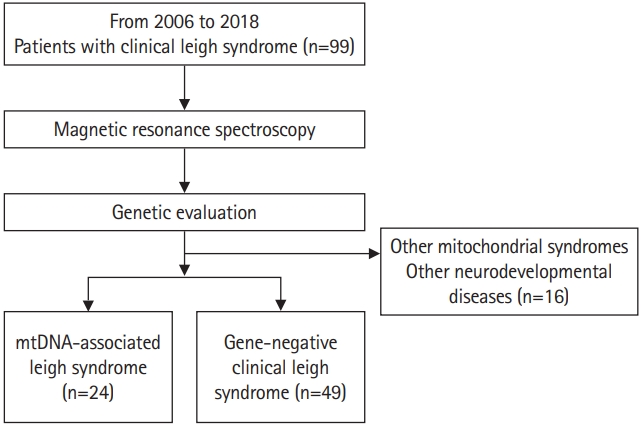
Study design and selection of patients. mtDNA, mitochondrial DNA.
2. Genetic evaluation of clinical LS
Whole mtDNA sequencing was performed for all patients using next-generation sequencing (NGS) technology. An extensive literature search was performed to confirm the mtDNA mutations used to diagnose mtDNA-associated LS. Patients with other mitochondrial diseases, such as mitochondrial encephalopathy, lactic acidosis, and stroke-like episodes (MELAS) were identified and excluded. Pathogenic variants, including point mutations and large deletions, can occur throughout the entire mitochondrial genome. Therefore, the diagnosis of mtDNA-associated LS should include the detection and quantification of any mitochondrial genome sequence change [15-17]. Each associated genotype change was classified with reference to pathogenic variants that have been confirmed to date. In some patients who were not diagnosed by whole mtDNA sequencing, diagnostic exome sequencing was performed. On this basis, 16 patients were excluded from the study because they were diagnosed with another mitochondrial syndrome or neurodevelopmental disease. Consequently, we included 24 patients with mtDNA-associated LS (Table 1 and Fig. 1). The remaining 49 patients were classified as having gene-negative LS.

Characteristics of mitochondrial DNA-associated Leigh syndrome patients (n=24)
3. Clinical characteristics of mtDNA-associated LS patients
We reviewed the clinical manifestations of mtDNA-associated LS. Sex, age at first clinical presentation and LS diagnosis and the corresponding time interval, a familial history of mitochondrial disease, the first symptom at disease onset, and organ involvement at diagnosis were examined (Table 2) [7,10].

Clinical characteristics of mitochondrial DNA-associated LS patients (n=24)
4. Mitochondrial characteristics of mtDNA-associated LS
We have summarised the results of the various tests performed to diagnose in Table 1. The mtDNA mutation subtypes, degree of serum lactic acidosis, muscle biopsy findings, mitochondrial respiratory chain (MRC) complex enzyme assay, and brain MRI findings were examined. In addition, the clinical severity of mtDNA-associated LS at diagnosis was graded as mild (if the patient was ambulatory and/or independent for daily activities) moderate (if the patient was partially dependent but able to express and understand directions), and severe (if the patient was totally dependent for daily activities or bedridden) [7,10].
5. Brain MRS findings of mtDNA-associated LS and comparison with gene-negative clinical LS
Localised proton (1H)-MRS was performed using a GE 750-W 3.0-T scanner (GE Healthcare, Chicago, IL, USA) with a 16-channel head-neck combined coil after T2-weighted and 2D fast-spin echo MRI. Single 20×20×20 mm3 voxel spectroscopy (repetition, echo [echo time (TE)], and acquisition time of 1,500 ms, 144 ms, and 3.48 minutes, respectively) was used. The voxel was placed by an MRI technician under the supervision of an experienced neuroradiologist. The regions of interest were located in the frontal and occipital grey matter and basal ganglia of the bilateral hemispheres. A rapid automated shimming method was developed using the machine. After water suppression and tuning, 1H-MRS spectra were obtained and directly analysed using the Functool 9.4.05 software in the GE Medical System. All data were processed using a Gaussian line and were analysed by two separate radiologists. Lactate and NAA level shifts were detected at 1.3 and 2.02 ppm, respectively. Lactate doublet peaks were also monitored at 1.3 ppm and confirmed by detecting an inversion on the half-TE sequence. The determination of the presence or absence of a lactate peak was made based on the basal ganglia. Lactate peaks and decreased NAA peaks were further categorised according to the readings of two separate neuroradiologists [10,11].
Thus, the MRS findings of mtDNA-associated LS were obtained and compared with those of gene-negative clinical LS to determine whether statistically significant differences were present.
6. Data analysis and statistical methods
Statistical analysis was performed using R version 4.1.0 (http://cran.r-project.org) and SPSS version 20.0 (IBM Corp., Armonk, NY, USA). Descriptive statistics were used, including percentages, means, and standard deviations. The chi-square test was applied to compare the differences between MRS findings of mtDNA-associated LS and gene-negative clinical LS. Statistical significance was set at P<0.05.
Results
1. Clinical characteristics of mtDNA-associated LS
Among the 24 mtDNA-associated LS patients, 15 were male. The mean ages at first clinical presentation and LS diagnosis were 1.9 years and 3.6 years, respectively, with a mean time interval of 25 months. There was a family history of mitochondrial disease in 16.7% of the cases. Delayed development was the most common symptom at disease onset (41.7%), followed by seizures (20.8%), motor weakness (16.7%), and ataxia (12.5%). All mtDNA-associated LS patients had neuromuscular involvement, with the eyes (41.5%), lungs (33.3%), and gastrointestinal system (25%) being the other involved major organs (Table 2).
2. Mitochondrial characteristics of mtDNA-associated LS patients
Among the 11 detected mtDNA mutation subtypes, m.10191T>C (20.8%), m.8993T>G (16.7%), m.8993T>C (12.5%), and m.9176T>C (12.5%) accounted for 62.5% of the total. Serum lactic acidosis was observed in 16 patients (66.7%). Muscle biopsy performed in 20 patients showed light microscopic changes and electron microscopic changes in six and 10 patients, respectively. In the enzyme assay, MRC complex I defects were observed in 13 patients. Brain MRI showed bilateral basal ganglia involvement in all patients, including the thalamus (45.8%), midbrain (54.1%), pons (33.3%), medulla (20.8%), cerebellum (58.3%), and cerebral atrophy (50.0%). Cortex (33.3%) and white matter (29.2%) involvement was also observed. Two-thirds (66.7%) of patients showed moderate to high clinical severity (Table 1).
3. MRS findings of mtDNA-associated LS and comparison with gene-negative clinical LS
As shown in Table 3, among the 24 mtDNA-associated LS patients, 66.7% (n=16) and 62.5% (n=15) showed lactate peaks and decreased NAA peaks, respectively. In contrast, among the 49 gene-negative clinical LS patients, 44.9% and 42.9% showed lactate peaks and decreased NAA peaks, respectively. Overall, the mtDNA-associated LS patients had a higher proportion of abnormal findings than the gene-negative clinical LS patients. However, the distribution of brain MRS findings between the two groups did not now statistically significant differences (lactate peak, P=0.080; decreased NAA peak, P=0.115).

Brain magnetic resonance spectroscopy findings of mtDNA-associated LS and comparison with gene-negative clinical LS
Discussion
Despite advances in brain MRI and genetic testing over the past few decades, diagnosing LS remains a challenge for many neurologists [3,5,6]. The present study investigated the usefulness of brain MRS for initial mtDNA-associated LS diagnosis. Brain MRS revealed lactate peaks and decreased NAA peaks in 66.7% and 62.5% of patients with mtDNA-associated LS, respectively. Our results showed a higher proportion of abnormal findings in mtDNA-associated LS patients than in gene-negative clinical LS patients. However, no significant differences were observed between the two groups of patients, suggesting that the current brain MRS technique is insufficient as a powerful and accurate initial diagnostic test for mtDNA-associated LS. Fig. 2 shows the brain MRS findings of two mtDNA-associated LS patients with the m.8993T>G mutation. As seen in the figure, lactate peaks can differ among LS patients with the same mutation type.

Basal ganglia in magnetic resonance spectroscopy (MRS) findings of two mitochondrial DNA (mtDNA)-associated Leigh syndrome patients, both of whom harboured the m.8993T>G variant. (A) Brain magnetic resonance imaging (MRI) findings in an 8-year-old boy, with an MRS image at repetition time (TR)/echo time (TE) 1,500/144 ms showing an inverted doublet at 1.3 ppm, consistent with a definite lactate peak (yellow arrow). The red arrows indicate the N-acetyl aspartate (NAA) peak. (B) Brain MRI findings in a 7-year-old girl, with an MRS image at TR/TE 1,500/144 ms showing no definite lactate peak or abnormal NAA peak (yellow arrow).
A single diagnostic tool for accurate LS diagnosis has not yet been developed. Nonetheless, clinical phenotypes, brain MRI and MRS findings, serum lactate levels, muscle biopsy, and respiratory enzyme studies have been used in combination to diagnose LS [18,19]. In recent years, genetic tests, such as whole mitochondrial sequencing, NGS, and whole exome sequencing, have been actively used for diagnosing this disease [6,9]. However, the diagnostic yield of these genetic tests for predicting gene-positive LS is only approximately 50% [14]. Therefore, MRI and MRS, as non-invasive brain imaging techniques, still have important implications in LS diagnosis. In several LS cases, brain MRS has been found to show abnormalities not observed in MRI, indicating that brain MRS can be advantageous for diagnosing LS [9,14].
Brain MRS is a widely known non-invasive imaging tool that can measure more than 20 brain tissue metabolites. Brain MRS has been used for diagnosing and examining brain tumours, mesial temporal lobe epilepsy, traumatic brain injuries, schizophrenia, and neurodegenerative diseases. In addition, brain MRS has been used as a major imaging tool for diagnosing mitochondrial diseases, including LS, in several previous studies [6,18,19]. The efficacy of MRS in mitochondrial diseases has been previously studied. Lee et al. [11] studied the usefulness of brain MRS in monitoring disease progression or improvement during the treatment of mitochondrial diseases. In addition, Lee et al. [10] showed that brain MRS findings in MELAS patients were correlated with serum biomarkers, such as serum lactate levels and the serum lactate-to-pyruvate ratio, and consequently, the disease stage. In this study, MRS was performed on average about 2 years after symptoms appeared. Accordingly, a limitation is that patients’ conditions may have been different at the time of diagnosis. Despite the limitations of brain MRS in the initial diagnosis of mtDNA-associated LS, it still has the potential to be used as a screening test for LS or a follow-up test in monitoring therapeutic response [6,7,12].
The brain MRS used in this study was 1H-MRS, with a magnetic field strength of 3.0 T. Currently, 31P and 13C-MRS, as well as ultra-high-field MRS with field strengths of 3.0 T and 9.4 T, are widely used in neuroscience and physiological research, and their clinical use is expected in the future. Compared with the existing 3.0 T MRS, ultra-high-field MRS has considerable advantages, such as rapid neurochemical profiling and metabolite mapping, high anatomical specificity, and the availability to analyse biomarkers that can be used to predict treatment response and disease monitoring [20,21]. The use of ultra-high-field MRS in clinical settings and related training of technicians will markedly improve the rate of LS diagnosis using imaging.
This study on brain MRS is highly significant, since MRS was consistently performed at a single tertiary medical institution for a long time and with a large number of patients with LS. To the best of our knowledge, this is the first study to explore significant differences in brain MRS findings between patients with mtDNA-associated LS and gene-negative clinical LS. Nonetheless, this study has some limitations. First, it did not quantify the lactate peaks and decreased NAA peaks as continuous variables. Second, the exact genetic results of gene-negative clinical LS as a control are currently unknown. Third, although this study was conducted at a single medical institution, it has the limitation of being a retrospective study [11]. Thus, we concluded that brain MRS currently has limitations as a test for the initial diagnosis of mtDNA-associated LS. However, brain MRS can be considered a valuable reference for routine follow-up testing in treating mtDNA-associated LS. In addition, if the development of ultra-high-field MRS technology and its clinical use are successful, brain MRS may be used as a potent diagnostic imaging tool for LS in the future [22,23].
Notes
Young-Mock Lee is an editorial board member of the journal, but he was not involved in the peer reviewer selection, evaluation, or decision process of this article. No other potential conflicts of interest relevant to this article were reported.
Author contribution
Conceptualization: JHN and YML. Data curation: JHN, JHS, and HL. Formal analysis: JHN and JHS. Methodology: YML. Writing-original draft: JHN. Writing-review & editing: JHN and YML.