Acoustic Voice Analysis in Children with Speech Sound Disorder and Intellectual Disability
Article information

Abstract
Purpose
This study was conducted to analyze the acoustic differences associated with the presence of speech sound disorder (SSD) and/or cognitive ability.
Methods
Medical records from 2016 to 2022 were retrospectively analyzed. The study included children aged 4 to 8 years who had undergone developmental assessments. Based on the assessment results, participants were divided into three groups: children with SSD without intellectual disability (ID), children with SSD and ID, and typically developing (TD) children. Voices were analyzed using the Multidimensional Voice Program (MDVP).
Results
The average ages of children with SSD, those with SSD and ID, and those categorized as TD were 61.0±11.4, 62.3±10.7, and 64.2±9.4 months, respectively (P=0.482). The proportion of children with SSD and ID who also had attention deficit hyperactivity disorder was significantly higher (53.3%) than in the other groups (P=0.010). In the MDVP analysis, among values related to fundamental frequency, the number of segments computed was significantly lower in children with SSD and ID compared to the other groups (SSD, 25.0; SSD with ID, 17.0; TD, 19.0; P=0.001). Similarly, the total number of pitch periods detected was significantly lower among those with both SSD and ID (SSD, 230.0; SSD with ID, 152.5; TD, 187.0; P=0.001). No other parameters significantly differed across groups.
Conclusion
Acoustic analysis can reflect voice changes in children with SSD and ID compared to both those with SSD and TD children. Therefore, voice analysis may serve as a supportive screening tool for patients with SSD.
Introduction
Speech sound disorder (SSD) is a communication disorder that affects between 10% and 15% of preschool-aged children [1]. This condition is marked by errors in speech sound production, which stem from deficits in articulation maturity, phonological processes, and cognitive-linguistic processes [2]. As children grow and their speech organs develop, they typically begin to produce a variety of speech sounds. At around 2 years old, children generally start to articulate simple nasals and plosives, followed by the completion of fricatives by the age of 5 to 7 years [3,4]. However, children with SSD are unable to articulate sounds in a manner that aligns with their chronological age. SSD is often used to describe language disorders that arise in the absence of cognitive, sensory, motor, or structural impairments; nonetheless, these disorders can be further classified into central or peripheral types based on their underlying cause [5]. Central causes of SSD are believed to originate from a breakdown in the speech processing system, specifically in areas involved in articulation such as the superior temporal gyrus (which includes Wernicke’s area and Heschl’s gyrus), the pre-motor gyrus, and Broca’s area [6]. In contrast, peripheral causes are associated with issues in the vocal apparatus, including the soft palate, larynx, and tongue (as with tongue-tie), which can impede speech production.
While the definition of SSD is limited to phonetic deficits, children with intellectual and/or linguistic impairments often exhibit lower articulation accuracy on average [7,8]. Children with SSD may also struggle with phonological awareness, which is linked to skills associated with reading [9,10]. Long-term observations have suggested that SSD impacts not only reading comprehension and literacy development but also overall academic achievement. Consequently, to understand the distinctions between children with SSD and typically developing (TD) children, a multidimensional analysis is necessary. Difficulties with phonological awareness may also predict the emergence of acoustic differences alongside phonological issues. Furthermore, these issues may plausibly influence language abilities and, in turn, affect cognitive and acoustic processing in children, given that SSD originates from functional issues pertaining to articulation and phonological construction.
The objective of this study was to examine the acoustic variations associated with the presence of SSD and cognitive abilities by comparing children with SSD alone, children with both SSD and intellectual disabilities (ID), and TD children.
Materials and Methods
1. Participants
TD children and those suspected of having SSD were examined using language-specific precision tests, cognitive assessments, articulation tests, and Multidimensional Voice Program (MDVP) analyses. The study participants were children between the ages of 4 and 8 years who were assessed at our center between 2016 and 2022. This age range was chosen to facilitate a thorough comparison between TD children and those with SSD, as most consonants are typically mastered by age 4, and complete articulation is generally achieved by age 8 in over 90% of children [11,12]. Individuals with neurological disorders that could affect language or cognitive abilities were not included in the study. The study participants were divided into three groups: (1) children with SSD who did not have ID, (2) children with SSD and coexisting ID, and (3) TD children. Children with SSD alone were defined as those with an intelligence quotient (IQ) greater than 70 on the Weschler Intelligence Scale and a consonant accuracy rate lower than 85% on the articulation test, whereas children with SSD and ID had an IQ of 70 or below and a consonant accuracy rate lower than 85%. TD children were characterized as having an IQ greater than 70 and a consonant accuracy rate of 85% or higher.
2. Data collection
Demographic factors, developmental assessment data, and acoustic parameters were compared across the three groups. Demographic factors encompassed age, sex, gestational age at birth, birth weight, mode of delivery, number of siblings, average daily screen time, and age at which the first word was spoken. Developmental assessment data included a comparison of results from various standardized tests, including the Receptive and Expressive Vocabulary Test (REVT), the Korean-Wechsler Preschool and Primary Scale of Intelligence Fourth Edition (K-WPPSI-IV), the Urimal Test of Articulation and Phonology (U-TAP), and attention deficit hyperactivity disorder (ADHD) rating scales. The REVT, which divides scores into receptive and expressive language domains, represents a comprehensive tool with a total of 188 questions for each domain, suitable for individuals ranging from young children to adults [13]. Scores are converted into a developmental quotient by dividing the language developmental age by the chronological age. Regarding cognitive assessment, the K-WPPSI-IV, a Korean adaptation of the Wechsler Intelligence Scale originally developed for children in 1949 [14], has been revised to clinically evaluate the cognitive abilities in children aged 2 years 6 months to 7 years 7 months [15]. This assessment yields five composite score indices: verbal comprehension, visual-spatial, fluid reasoning, working memory, and processing speed. These indices are aggregated to measure the full-scale IQ, which forms the basis for the patient’s IQ score. U-TAP is employed to identify the presence of SSD by presenting images to assess the accuracy of articulation and phonology in words and sentences. The test is segmented into word and sentence levels, with scores reflecting the percentage of accurately pronounced consonants out of a total of 43 [16]. Pronunciation errors are classified as substitutions, distortions, or omissions. For the MDVP analysis, recorded vocal sounds are analyzed. To facilitate a consistent acoustic analysis for both SSD and TD children, participants are instructed to repeat the same syllable three times. The voice recordings are captured using a microphone positioned 10 cm from the speaker.
The acoustic elements analyzed with the MDVP are categorized into four groups: fundamental frequency (F0) parameters, frequency perturbation measurements, amplitude perturbation measurements, and noise measurements [17]. Fundamental frequency parameters include the average fundamental frequency (Fo), mean fundamental frequency (mF0), average pitch period (To), highest fundamental frequency (Fhi), lowest fundamental frequency (Flo), standard deviation of Fo, phonatory Fo-range in semitones (PFR), number of segments computed (SEG), and total number of pitch periods detected (PER). Frequency perturbation encompasses the measurements of absolute jitter in microseconds, jitter percent, relative average perturbation, pitch perturbation quotient (PPQ), smoothed PPQ, and fundamental frequency variation. Amplitude perturbation includes shimmer, shimmer in dB, amplitude perturbation quotient, and peak-to-peak amplitude. Finally, noise measurements include the noise-to-harmonic ratio, voice turbulence index, soft phonation index, degree of voice breaks, degree of subharmonics, and degree of voicelessness [18].
3. Ethical considerations
The study received approval from the Institutional Review Board and Ethics Committee of Jeonbuk National University Hospital (JBNUH), under the approval number CUH 2022-04-008. Due to the retrospective nature of the study, the requirement for written informed consent from the patients was waived.
4. Statistical analysis
Statistical analyses were performed using SPSS version 23.0 (IBM Corp., Armonk, NY, USA). The Shapiro-Wilk test was utilized to assess the normality of the quantitative data. Variables that followed a normal distribution were expressed as the mean±standard deviation, and differences among the three groups were evaluated using one-way analysis of variance. Variables that did not follow a normal distribution were expressed as the median (interquartile range). Clinical characteristics and demographic data were summarized as either mean±standard deviation or median (interquartile range), as appropriate. The Kruskal-Wallis test was employed to examine differences among variables. For categorical data, the chi-square test was used to determine statistically significant differences. A P value of less than 0.05 was considered to indicate statistical significance.
Results
1. Demographic factors and clinical characteristics
During the research period, a total of 496 patients aged 4 to 8 years underwent developmental assessments at our institution. We excluded from the study several children with moderate to severe ID who were unable to complete accurate phonation and articulation assessments appropriate for their age. Patients were also excluded if they had not participated in any of the following assessments: REVT, K-WPPSI-IV, U-TAP, and MDVP. Ultimately, 95 research participants were recruited and categorized into three groups based on their assessment results: SSD only, SSD with ID, and TD. The groups comprised 33 children with SSD only, 30 children with SSD and ID, and 32 TD children, with average ages of 61.0±11.4, 62.3±10.7, and 64.2±9.4 months, respectively. No significant age differences were found among the groups (P=0.482) (Table 1). All groups had a predominance of male patients, and no significant differences were observed in birth weight, delivery method, sibling relationships, feeding methods, or screen time (P>0.05). The age at which children with SSD alone expressed their first word was 14.6±5.4 months; this did not differ significantly from the TD group, who expressed their first word at 16.8±8.8 months (P=0.002). However, children with SSD and ID showed significantly delayed first word expression, with an average age of 21.7±9.3 months. Additionally, ADHD tendencies were significantly more common in children with SSD and ID (P=0.010), affecting 53.3% of this group. This group also had a significantly lower average IQ than the other groups, at 60.9±7.9 (P<0.001).
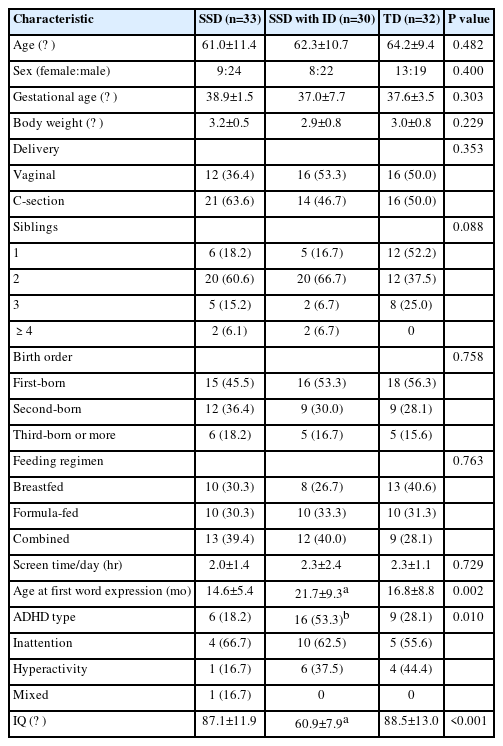
Comparison of demographics and clinical characteristics across groups
2. Language abilities according to SSD and/or ID
Children with SSD and ID exhibited a lower developmental quotient than children with only SSD and TD children in terms of receptive and expressive vocabulary skills. However, children with SSD alone showed no significant difference in vocabulary skills relative to TD children (P<0.001) (Table 2). Regarding the U-TAP score, the group with SSD alone achieved a consonant accuracy of 72.1%, whereas the group with both SSD and ID exhibited a consonant accuracy of 75.5%. No significant differences were found in consonant error patterns, which include substitution, distortion, and omission, between these two groups.

Comparison of language abilities and articulation accuracy across groups
3. MDVP analysis
Within the category of fundamental frequency parameters, no significant differences were observed for Fo, mF0, To, Fhi, Flo, standard deviation of F0 (STD), and PFR (P>0.05) (Table 3). However, SEG and PER demonstrated statistically significant differences, as illustrated in Fig. 1 (P=0.001). Specifically, SEG values were markedly lower in children with SSD accompanied by ID, with median values reported at 25.0 for children with SSD alone, 17.0 for those with SSD and ID, and 19.0 for TD children. Similarly, PER values were significantly lower in the SSD with ID group, with median values of 230.0 for SSD only children, 152.5 for SSD children with ID, and 187.0 for TD children. No significant differences were detected in the parameters of frequency perturbation, amplitude perturbation, or noise measurements across all categories (P>0.05) (Table 4).

Quantitative analysis of fundamental frequency parameters

Quantitative analysis of fundamental frequency parameters with significant differences. (A) Number of segments computed. (B) Number of detected pitch periods. SSD, speech sound disorder; ID, intellectual disability; TD, typically developing child. aP<0.01.
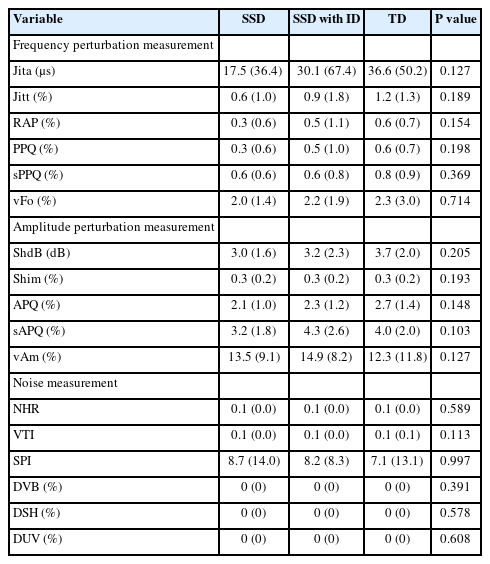
Differences in acoustic voice parameters by group
Discussion
This study was conducted to compare the acoustic characteristics of TD children with those of children with SSD, considering the presence of ID in pediatric populations. This was accomplished through MDVP analysis. The objective was to explore the potential of acoustic analysis as a tool for differentiating between SSDs with and without accompanying ID.
In the comparison between children with SSD only and those with SSD and ID, no significant differences were found in clinical characteristics other than older age of first word expression, lower IQ, and higher rate of ADHD comorbidity. These differences can be attributed to the characteristics commonly associated with ID [19]. In vocabulary assessments, children with SSD and ID demonstrated significantly poorer vocabulary skills compared to the two groups without ID. However, among children with SSD only, their vocabulary skills did not significantly differ from those of TD children. Additionally, no significant differences were observed in the three patterns of articulation errors—substitution, distortion, and omission—between children with SSD and those with SSD and ID.
In this study, we confirmed that children with SSD who also have ID exhibit distinct differences in F0 parameters relative to children of normal intellectual ability who have SSD, as well as to TD children. The human voice consists of complex, periodic waves produced via the combination of simple waves. F0 is the lowest frequency in these periodic waves and typically ranges from 85 to 155 Hz [20]. This frequency is known to be lower in male than female individuals and tends to decrease with age [21,22]. F0 is also a key characteristic by which voice is distinguished and can vary substantially due to cultural and linguistic factors. Changes in F0 can occur as a result of various medical conditions, including voice disorders, sex-based hormonal differences, changes in laryngeal position, and movement disorders such as Parkinson disease [23-25]. However, the acoustic characteristics of individuals with SSD and/or ID, particularly children, have not been extensively studied. Coppens-Hofman et al. [26] found that individuals with mild to moderate ID often face challenges in speech production and exhibit a high rate of errors in phonological processes. Additionally, adults with ID of unknown etiology have been observed to display a narrower range of frequency variability, which leads to a monotone voice quality [27,28]. In the present study, among the F0 elements, the low values of SEG in children with SSD and ID suggest that their speech segments are shorter, resulting in a reduced overall length of vocalization. Similarly, the low values of PER indicate a decrease in the periodicity of vocal fold vibrations in these children. This suggests that the speech of children with SSD and ID may sound relatively monotonous due to the brevity of their utterances and the diminished periodicity of their vocal fold vibrations. However, neither children with SSD nor TD children exhibited these acoustic differences. This indicates that ID may be a contributing factor to acoustic differences rather than phonological processes. Thus, patients with SSD and ID demonstrated less variability and less harmonic speech compared to those without ID.
Frequency perturbation is recognized as an indicator of irregularities in vocal fold vibrations during speech production [29]. This can be influenced by various factors, including the aging of the vocal folds, prolonged vocal fold usage, and changes in muscle tension [30]. However, in this study, no significant differences in frequency perturbation were observed based on SSD or ID status. Amplitude perturbation and noise measurement also typically increase with age and are associated with a decline in laryngeal control [31]. However, these are not considered to relate to intelligence or articulation skills. The present research is noteworthy as it expands upon prior findings from adult patients with ID to include the pediatric population, while highlighting notable variations in acoustic parameters. Despite these findings, it remains difficult to ascertain whether the acoustic differences found in children with SSD and ID are attributable to variations in intelligence or to the presence of SSD. Further comparative research is needed to explore the distinctions between children with ID alone and those with both SSD and ID.
Due to limited comprehension and difficulties in cooperation, collecting data from children can pose challenges, particularly when they have severe ID. In future research, it may be necessary to include older participants in the study population, among whom MDVP and articulation assessments are feasible even in cases of ID. This approach would help determine whether the impact on the parameters is due solely to ID or to the concurrent presence of SSD. Furthermore, it is important to note that physiological changes related to the fundamental frequency, such as alternations in vocal fold length, sex-related differences, and anatomical changes in the larynx during growth, may influence these measurements. Therefore, future studies should explore methods to control for these factors in participant selection. This would enable a more objective analysis and provide valuable information for supplementary research.
In this study, children with SSD exhibited a monotonous speech pattern with a lower fundamental frequency when also presenting with ID. These findings suggest that ID may have a greater impact on acoustic characteristics than on the processes involved in phonological formation.
Notes
No potential conflict of interest relevant to this article was reported.
Author contribution
Conceptualization: MJH and SJK. Data curation: MJH, MKS, and SJK. Formal analysis: MJH. Methodology: MJH and SJK. Visualization: MJH. Writing-original draft: MJH. Writing-review & editing: MJH.