Limbic System and Optic Nerve Diffusion Restriction in a Child with Biotinidase Deficiency
Article information

Congenital biotinidase deficiency (CBD) is a rare, autosomal recessive, reversible metabolic encephalopathy caused by pathogenic variants in the biotinidase (BTD) gene (Online Mendelian Inheritance in Man 609019). Biotin serves as a cofactor for four carboxylase enzymes (pyruvate carboxylase, propionyl CoA carboxylase, 3-methylcrotonyl CoA carboxylase, and acetyl CoA carboxylase) required for fatty acid synthesis, amino acid metabolism, and gluconeogenesis. A deficiency in biotinidase disrupts biotin recycling and the release of biotin bound to dietary proteins, leading to reduced biotin availability for carboxylase enzymes. This results in energy depletion and metabolic acidosis [1].
Children with biotinidase and multiple carboxylase deficiencies typically present symptoms within the first 2 years of life. These may include tachypnoea, stridor, skin rash, feeding difficulties, vomiting, hypotonia, developmental delay, seizures, irritability, lethargy, and coma. Recent studies describing the demographic distribution of patients with CBD have categorised them into early infantile, early childhood, and late childhood groups, based on their age of presentation. These age ranges are as follows: under 3 months, between 18 and 24 months, and between 5 and 14 years, respectively [2].
In late childhood, as demonstrated in our case, the clinical presentation of progressive encephalopathy often includes symptoms such as skin rash, alopecia, hypotonia, spasticity, seizures, and hearing loss [2,3].
We present the case of a 9-year-old child, born to non-consanguineous parents, who was brought to us with bilateral lower limb weakness. This weakness caused knee buckling, gait disturbances, and frequent falls, progressing from the right to the left lower limb. The condition advanced to the point where the child required support to walk. Subsequently, he developed distal upper limb weakness, which manifested as difficulty mixing food. The child had no family history of neurological disorders, either genetic or acquired. Prior to presenting at our institute, he had a normal developmental and birth history.
The child was initially admitted with the aforementioned complaints, and magnetic resonance imaging (MRI) of the brain was performed. The index imaging showed no neuroparenchymal abnormalities, and the patient was discharged with multivitamin supplements. However, the patient was readmitted after 15 days due to the progression of symptoms, including increased bilateral lower limb weakness that rendered him unable to stand, upper limb tremors, and decreased sensations in both lower limbs.
Clinical examination revealed bilateral ankle clonus, reduced tone and power in all four limbs, and preserved higher motor functions. The child also experienced painless loss of vision. An ophthalmological evaluation showed bilateral disc pallor and bilateral absence of P100 (vs. a positive peak normally occurring around 100 ms) in a goggle visual-evoked potential evaluation, suggesting optic neuritis. The child’s hearing function remained intact. The patient received three cycles of plasma exchange and was started on intravenous immunoglobulin and intravenous pulsed methylprednisolone before being discharged on oral steroids. Arterial blood gas analysis and serum electrolytes were within the normal ranges. The serum lactate level was mildly elevated (26.9 mg/dL, normal range up to 19.8 mg/dL) upon initial evaluation.
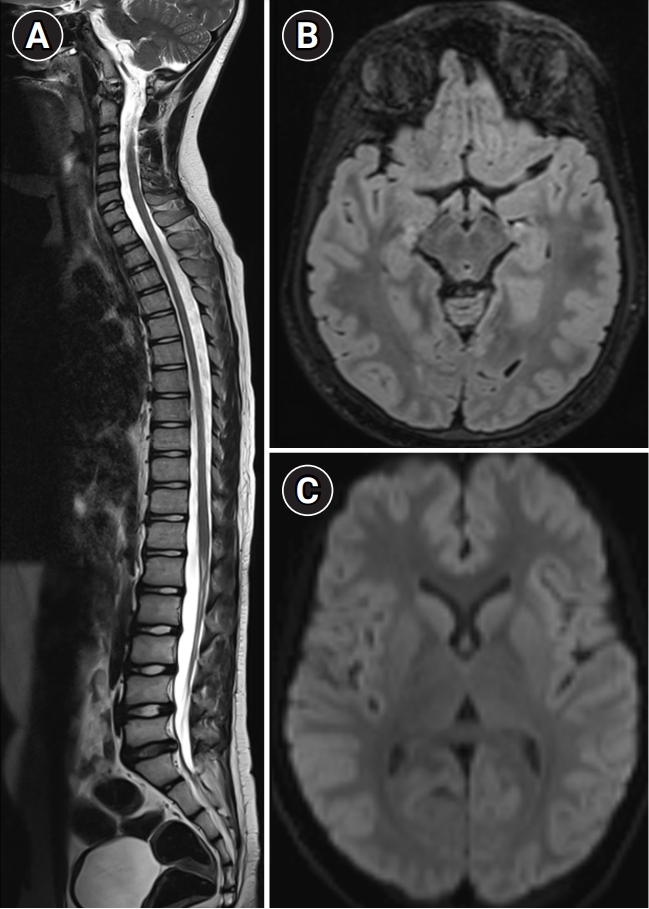
A second MRI examination of the brain revealed diffusion restriction along the body and crux of the fornix, hippocampi, and left optic nerve (Fig. 1). Symmetric hyperintensities on T2-weighted and fluid-attenuated inversion recovery sequences were observed in the optic tracts, mammillary bodies, periaqueductal grey matter, and dorsal midbrain (Fig. 1). MRI of the spine showed mildly expansile, longitudinally extensive signal changes from the cervicomedullary junction to the conus, involving the dorsal and lateral columns (Fig. 1B). The distribution of signal changes prompted tandem mass spectroscopy (TMS), which indicated elevated propionyl-carnitine and methyl-malonyl carnitine levels. A biotinidase quantitative assay revealed a very low level (0.52 nmol/min/mL; normal range, 3.1 to 6.7). Based on the clinical, biochemical, and MRI findings, the diagnosis of CBD was confirmed.

(A, B) Diffusion and corresponding (C, D) apparent diffusion coefficient images display diffusion restriction in the crux and body of the fornix (A, B: white arrows; C, D: black arrows). (E) Axial fluid-attenuated inversion recovery at the midbrain level reveals symmetric, mildly expansile hyperintensity (white arrows) in the optic tracts, mammillary bodies, and periaqueductal region. (H) The whole spine sagittal section of T2-weighted magnetic resonance imaging (MRI) exhibits mildly expansile, longitudinally extensive signal changes with a predilection for the dorsal and lateral columns (black arrows), as demonstrated in the axial section (F). (G) Diffusion MRI reveals diffusion limitation in the intraorbital segment of the left optic nerve (white arrow).
Following this diagnosis, treatment with a multivitamin cocktail combined with 10 mg of biotin was initiated. Subsequent TMS results were unremarkable, and a repeat serum lactate test was also within normal limits. MRI performed 1 year after the onset of symptoms demonstrated complete resolution of neuroparenchymal and optic nerve signal changes (Fig. 2).
Follow-up magnetic resonance imaging (MRI) after 1 year shows complete resolution of MRI signal changes in the spinal cord (A). (B) Axial fluid-attenuated inversion recovery at the midbrain level demonstrates the resolution of signal changes in the optic tracts, mammillary bodies, and periaqueductal region. (C) Diffusion-weighted imaging demonstrates the resolution of restriction in the crux and body of the fornix.
Clinically, the patient demonstrated gradual improvement. During the initial 3 months, he experienced persistent visual blurring and lower limb weakness. After receiving a course of 10 mg biotin administered twice daily for a period of 3 months, the dose was increased to 50 mg, taken three times daily. Subsequently, the patient’s visual problems were completely resolved, although lower limb spasticity persisted, necessitating the use of support for walking.
CBD can present similarly to Leigh disease or thiamine deficiency, with necrotising lesions found in various regions of the brain, including the cerebral white matter, thalamus, hypothalamus, hippocampus, mammillary bodies, substantia nigra, periaqueductal grey matter, pontine tegmentum, dorsomedial parts of the medulla, deep cerebellar white matter, cerebellar nuclei, and the posterior, lateral, and anterior columns of the spinal cord. Symmetrical diffusion-restricting lesions have been described in the brainstem corticospinal tracts, internal capsules, middle cerebellar peduncles, splenium of the corpus callosum, corona radiata, perirolandic white matter, centrum semiovale, parieto-occipital grey matter, hippocampus, optic, and central tegmental tracts. Our case uniquely featured diffusion restriction in the fornix and hippocampus, accompanied by optic neuritis.
Diffusion restriction may be attributed to vacuolating myelinopathy in biotinidase deficiency [2,4]. Biotinidase activity in extracts of the cerebrum, cerebellum, and brainstem is notably low compared to other tissues. This may be due to either low concentrations of the enzyme throughout the brain or the enzyme being located only in specific areas of the brain, which could explain the characteristic distribution of lesions observed on MRI [5].
Recently, a multicentre case series of CBD revealed signal abnormalities in the fornices in three out of 14 cases reviewed [2]. Moreover, as reported in this series, spinal cord involvement in late childhood onset CBD, along with forniceal involvement and a clinical history of hearing loss, visual complaints, and encephalopathy, could essentially serve as an indicator for CBD.
Neuromyelitis optica (NMO) and myelin oligodendrocyte glycoprotein antibody disease (MOG-AD) can exhibit similar MRI findings; however, diffusion restriction in the limbic system is atypical for both NMO and MOG-AD [6]. Furthermore, the chronology of clinical symptoms, which is essentially monophasic, is quite rare in this age group for inflammatory disorders. The presence of polyphasic symptoms should encourage careful consideration of neurometabolic conditions. After excluding these conditions, it may be appropriate to consider neuroinflammatory disorders.
Early recognition of this clinical entity is crucial, as clinical symptoms can be reversed with biotin supplementation. To ensure early identification of this condition, new-born screening should incorporate a biotinidase enzyme assay, as simple biotin supplementation can prevent the manifestation of clinical symptoms in the future. In our index case, new-born screening was not conducted, leading to a delayed clinical presentation. It is worth noting that routine screening for CBD has yet to become widespread in India. The significant clinical and radiological improvement (Fig. 2) observed in our index case after biotin supplementation underscores the importance of including routine screening for this disorder in new-born screening programmes. Informed consent was obtained from the patient and his parents with the institutional ethics committee (Basic sciences & Neurosciences division)-NIMHANS (IRB:74916) for the publication of this case.
Notes
No potential conflict of interest relevant to this article was reported.
Author contribution
Conceptualization: GVNP. Writing-original draft: GVNP and SA. Writing-review & editing: CP, JS, and KK.